Graphs of OEE and related percentage measures are displayed as Line Graphs with a time-scale or department on the X-axis and percentage on the Y-axis. A line of best fit is included by default.
You can select the lines & machines you want and the time period to be displayed. Labour Hour Efficiency graphs are presented in the same way.
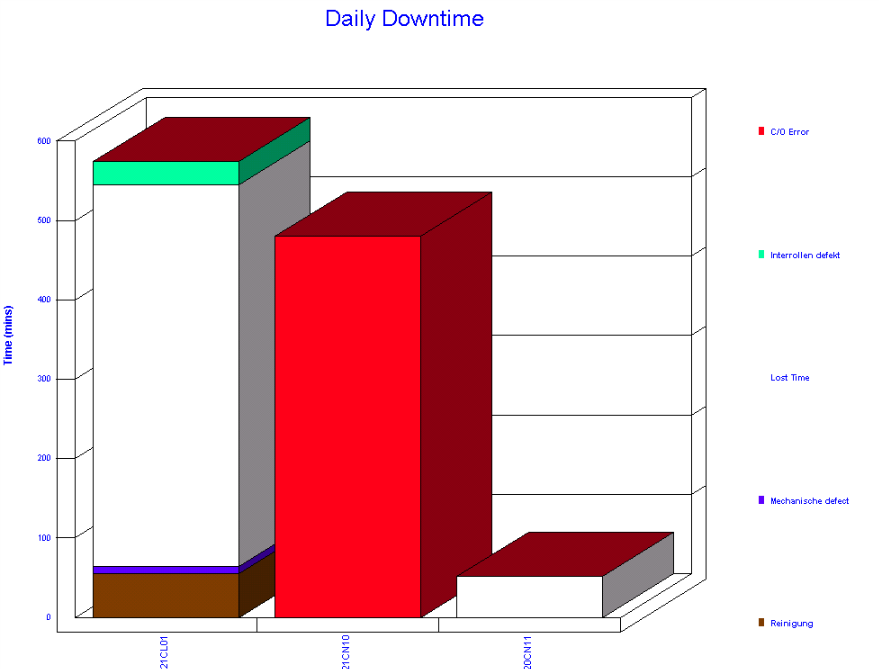
Graphs showing Reason for Down Time can display different criteria along the X-axis and either time or units of production on the Y-axis. This will give a stacked bar graph with different blocks according to Reason.
The Show option determines the contents of the stack. You also have an option of sorting the order along the X-axis.
Selecting the Pie Chart option forces the X-axis to display the same information chosen in Show.
Following Preview, all Graphs can be either printed to the default printer or copied to the Clipboard for pasting into other applications, Word, Excel, etc.